My personal laptop is a Sony Vaio V505CP. It’s almost five years old, but after upgrading it to 1.5 GB RAM and a 160 GB hard drive, it does a good job of running Windows Vista SP1. I use it mainly when I’m out on consulting jobs or travelling, so I don’t need anything more powerful.
A month or two back, I noticed that whenever I played music, the audio would glitch every 20-30 seconds. The mouse pointer also froze briefly during the glitches. This was something new — it was working fine after the original upgrade to Vista SP1. Today, I finally got around to investigating the cause.
For those in a hurry: the culprit was NDIS.SYS, the network driver. Simply turning off the built-in wireless adapter (easily done with a switch on the front of the Sony’s case) made the glitch go away. I can live with this for now, since I rarely use wireless and stream music at the same time; normally, I leave the wireless enabled all the time, just in case I might need it, but it’s not a big deal to turn it off.
So how did I figure this out? Here are the steps I followed, including dead ends (the journey is often as interesting as the destination).
My first port of call was Windows Task Manager. I usually start here, simply because Task Manager is standard on every Windows PC. In this case, it showed a big CPU spike whenever the glitch occurred, but unfortunately, Task Manager itself froze during the glitch so I couldn’t identify what process was responsible.
The next tool to try was Process Explorer from SysInternals, a wonderful tool for all kinds of system probing. It includes a dummy task entry for DPC (Deferred Procedure Calls) and so I could see that during glitches, DPC was particularly active, responsible for almost all the additional CPU usage.
Deferred Procedure Calls are used whenever a process needs to make a system call, but the system is busy doing something important like handling an interrupt. The system call is queued until the interrupt completes, and all outstanding calls are then executed in sequence — hence the brief jump in CPU activity.
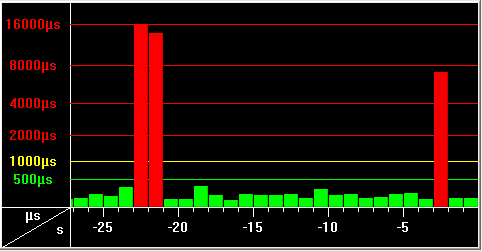
Some Googling brought me to a handy tool called DPC Latency Checker, which graphs DPC usage over time. Using this confirmed the theory:

The red peaks indicate unusually long DPC latencies, which will cause system problems. Unfortunately, the checker didn’t tell me the cause of these, but I knew it was probably a badly written device driver. The checker’s website suggested using Microsoft’s RATTv3 developer tool to identify the culprit.
I hadn’t come across RATTv3 before, but it’s very useful — if you’re running Windows XP, that is. It records the latency of each and every device driver’s interrupt calls, correlated over time, and identifies the bad ones for you. Unfortunately, it doesn’t work too well under Vista.
Back to Google, where I found a thread suggesting Microsoft’s new Performance Toolkit as a good Vista alternative. This does everything RATTv3 can do, and a lot more besides.
Update Dec 2015: this is now part of Microsoft’s Windows Assessment and Deployment Kit (ADK) — it still works on Windows 7, despite Windows 8.1 references.
One thing to watch out for: after installing the toolkit, all the files end up in “C:\Program Files\Microsoft Windows Performance Toolkit”. I suggest copying them to C:\XPerf for convenience, since the installation folder is not added to the system path automatically.
After installing, you can begin a new capture by opening a command prompt in the toolkit folder and typing:
xperf -on DiagEasy
to begin tracing. Then let the system run for a minute or two, until the glitch has occurred. Next, turn off tracing and convert the results to a file suitable for viewing:
xperf -d trace.etl
Finally, view the accumulated results:
xperf trace.etl
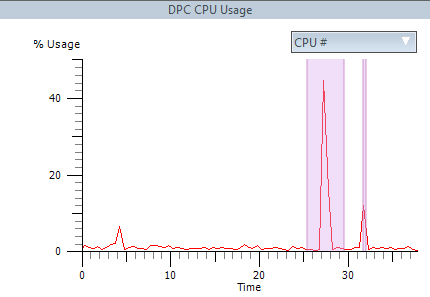
Pretty easy! Doing this produced a summary page with a ton of detail, most of which I didn’t need (CPU usage, disk i/o, etc.) The thing I was interested in was DPC activity, which it showed as a graph like this:

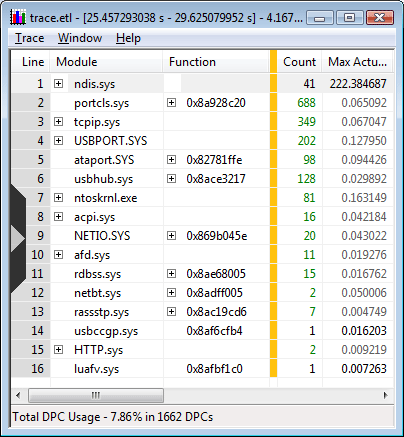
The peaks in the graph show unexpectedly high DPC levels. By selecting one of those peaks and right-clicking, I was able to display a summary of all the driver activity that had contributed to the peak:

From this, it was clear that NDIS.SYS was the culprit, with a worst-case latency of more than 200 ms. (I repeated the test several times to confirm this, and it was consistently in top place.)
So mystery solved. From here, it was an easy step to try disabling the network adapters to see if that fixed things — and turning off the wirless adapter did the trick.
So when I have a chance, I’ll upgrade my wireless driver and hopefully that will sort it out permanently. For now, though, I’m just glad to have properly working audio again.